What Breaks in Voice AI at High Call Concurrency? The GPU Math Most Teams Get Wrong
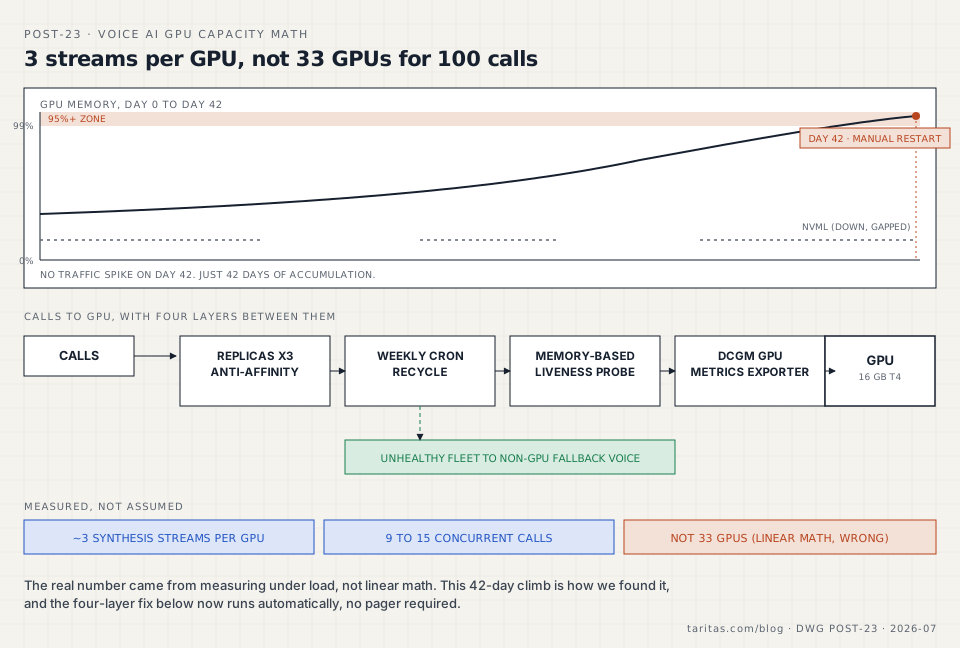
At high call concurrency, voice AI rarely breaks from call volume alone. It breaks where a specific component was never tested under sustained concurrent use. At taritas, that component was a self-hosted GPU running our text-to-speech model. Its memory slowly filled to 99 percent over 42 days, with no spike in calls, because nothing was watching the trend closely enough, and the monitoring that should have shown the climb had failed at the same time. The fix was not a bigger GPU. It was measuring the real number, about 3 concurrent synthesis streams per GPU, which supports 9 to 15 concurrent calls once you account for turn-taking. An earlier linear estimate had assumed 100 concurrent calls would need about 33 GPUs, wrong by an order of magnitude. Around that measured number we built four layers of automatic recovery: replicas, scheduled recycling, a memory-based health check, and dedicated GPU monitoring.
Published · Updated · Supreet Tare
All names, numbers, and identifiers in this post are anonymized. The patterns are real.
The number most teams get wrong
One GPU handles far more concurrent calls than most capacity plans assume. Here is the number worth remembering: a 16 GB GPU running a self-hosted text-to-speech model supports about 3 concurrent synthesis streams. Because a phone call has turn-taking, only one side speaking at a time, those 3 streams support roughly 9 to 15 concurrent calls, not 3.
An early estimate on one of our projects assumed the opposite. It scaled per call, in a straight line: 100 concurrent calls would need about 33 GPUs. That estimate was off by a factor of ten. The real number, measured under load, was a handful of GPUs from a small buffer already sitting idle.
The lesson generalizes past this one project. Any capacity plan for voice AI that multiplies calls by resource-per-call in a straight line is almost certainly wrong. It ignores turn-taking, batching, and the gap between peak and average load. Measure the real concurrent-streams-per-GPU number before you provision anything.
How we found that number
One of our voice agents answers a public-sector service desk’s phone line. It speaks through a self-hosted text-to-speech model, Chatterbox Turbo, running on a single GPU node, an Azure NC4as_T4_v3 with a 16 GB Tesla T4. We self-host it because the managed standard voice available in the client’s required region had been judged too robotic for a citizen-facing line. We cover that decision, and the managed voice generation that later changed the calculus, in our TTS journey post.
This is one of three related answers to what breaks at high call concurrency, alongside a call-transfer gateway that dropped calls at a fixed timeout (the Envoy timeout story) and a per-tenant database counter that needed to be atomic under concurrent writes (the Postgres rate limiter story). None of the three were about raw call volume. Each was a specific component that had never been tested under sustained concurrent load.
The GPU story started as an operations incident. After 42 days of uninterrupted pod uptime, the GPU’s memory reached 99 percent and needed a manual restart. There was no spike in call volume that day, just slow accumulation the whole time. Uptime had looked like health. It was actually the clock on a slow leak nobody was watching.
Restarting the pod fixed the incident immediately, which told us this was resource exhaustion, not a logic bug. Confirming the slow-leak theory was harder, because the metrics we needed were themselves unreliable. The node’s monitoring layer intermittently threw “Failed to initialize NVML,” NVIDIA’s library for GPU metrics, while the model kept generating speech normally through CUDA, the separate compute layer underneath it. Compute and monitoring are two different systems on the same card. One had failed while the other kept working, and we saw the same failure again on a different node during a later check.
The capacity math correction above came out of the same investigation, done for an unrelated reason: planning for more concurrent calls. Finding the real number, and finding why the linear estimate was wrong, became the most useful part of the whole incident.
The root cause
To state it plainly: the GPU did not fail. It filled up exactly as any long-running GPU process will, on a single node with no replica and no scheduled reset, and the monitoring that should have shown the trend had a failure of its own running at the same time. Three things made this hard to catch: uptime looked like health, the metric that would have shown the slope was itself down in a way that never touched inference, and a single-GPU setup meant the first real signal was a caller hearing degraded voice quality.
The fix: four layers, not one restart
Restarting the pod fixed the immediate incident. It did not fix the underlying risk. Any long-running GPU model server should be assumed to leak, and the system around it has to absorb that automatically.
Replicas, so no single GPU is a single point of failure.
apiVersion: apps/v1
kind: Deployment
metadata:
  name: tts-server
spec:
  replicas: 3
  template:
    spec:
      affinity:
        podAntiAffinity:
          requiredDuringSchedulingIgnoredDuringExecution:
            - labelSelector:
                matchLabels:
                  app: tts-server
              topologyKey: kubernetes.io/hostname
A scheduled restart, so the leak gets amnesty on a calendar instead of a pager.
apiVersion: batch/v1
kind: CronJob
metadata:
  name: tts-weekly-recycle
spec:
  schedule: "0 4 * * 0"
  jobTemplate:
    spec:
      template:
        spec:
          containers:
            - name: recycle
              image: bitnami/kubectl
              command: ["kubectl", "rollout", "restart", "deployment/tts-server"]
          restartPolicy: OnFailure
A memory-based liveness probe, checking GPU memory against a threshold, so a leaking pod recycles itself before quality degrades.
Dedicated GPU observability, using NVIDIA’s DCGM exporter for real per-GPU metrics. DCGM’s own health also surfaces separately from the model’s inference path, so it catches the NVML-down state itself.
Scaling on top of these four layers uses three signals together. A scheduled cron baseline covers known busy periods. An active-calls counter is the primary, leading indicator, since a caller entering a queue predicts synthesis load before the GPU feels it. GPU utilization is only a safety net, because by the time utilization alone triggers a scale-up, callers are often already hearing the delay.
def on_call_start():
    redis_client.incr("voice:active_calls")  # agent-side admission signal
    redis_client.expire("voice:active_calls", ttl=CALL_TIMEOUT_SECONDS)

def on_call_end():
    redis_client.decr("voice:active_calls")  # hangup or failure, either way

def choose_tts_backend():
    if tts_fleet_saturated_or_unhealthy():
        return "managed_fallback_voice"  # avoid queueing calls indefinitely
    return "self_hosted_gpu_voice"
That fallback path matters as much as the scaling logic. A tested, non-GPU text-to-speech option turns a GPU incident into a brief quality dip instead of a caller hearing dead air.
Hardening
- Treat uptime as a risk signal for any model server holding a GPU, not a sign of health. Anything running for weeks needs a scheduled recycle.
- Alert on the slope of GPU memory, not just the level. The 42-day climb to 99 percent was visible as a trend long before it became an incident.
- Monitor the monitor. Give a GPU metrics exporter its own health alert, since its failure mode looks like everything is fine.
- Keep a tested, non-GPU fallback voice path wired in at all times.
- Plan capacity from a measured concurrent-streams-per-GPU number and real turn-taking behavior, never from a linear per-call estimate.
Key takeaways
- Measure your own concurrent-streams-per-GPU number before you plan capacity. Do not estimate it. A linear per-call estimate can overstate GPU needs by an order of magnitude, as it did here.
- If you run a self-hosted GPU model server, put a scheduled recycle on the calendar now, before uptime turns into an incident.
- Check whether your GPU metrics exporter has its own health alert, separate from the metrics it reports. If it does not, add one this week.
- Confirm you have a tested, non-GPU fallback path for your voice pipeline. If you have never tested it under load, that is the gap to close next.
What this means if you are an IT services firm
Ask your team three questions about any voice AI running on a self-hosted GPU: what is our measured concurrent-streams-per-GPU number, what is the recycle schedule, and what happens when the GPU metrics themselves go down. If any answer is “we have not checked,” that is the next thing to test, before a client’s production concurrency finds the gap for you. This kind of capacity planning and GPU operations work is part of what we do behind IT services firms, under their brand.
Reading this because a client asked for voice AI? That is the conversation we are built for. What taritas does for partners.